Burning and Debugging Tools for TLSR9 Series in Linux
Introduction
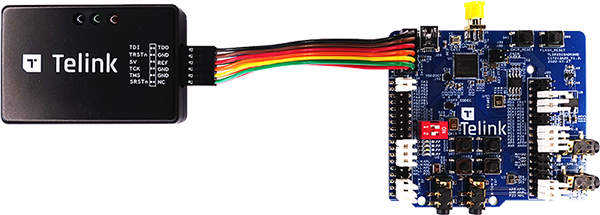
This memo explains how to program the B91 EVK with the SPI Burn tool and TLSR9 DEV KEY (Telink debug probe) in Linux. It is assumed that you already know how to connect the TLSR9 DEV KEY to the B91 EVK.
Environment Setup
GCC toolchain
Download the Telink RISC-V Linux Toolchain and unzip it to a local folder in your Linux computer.
Run the following commands one by one below to install all the required libraries.
NOTE: It is assumed that the Linux machine is running a 64-bit Ubuntu 18.04/20.04 LTS. If other Linux distributions are used, you might have to change the commands below accordingly.
sudo dpkg --add-architecture i386
sudo apt-get update
sudo apt-get install libc6:i386 libncurses5:i386 libstdc++6:i386
Example code
Extract the content of the gdb_example.zip file into a folder named example, which in the example below is assumed to be located in your ‘home’ folder.
Flash Programming
Follow the procedure below to download the binary file main.bin to the B91 EVK.
- Make sure the TLSR9 DEV KEY is connected to the B91 EVK correctly and the EVK is already powered.
-
Launch a shell.
-
Navigate to the ice folder in which the ICEman tool is located (e.g. /opt/toolchain/telink_riscv_linux_toolchain/ice).
-
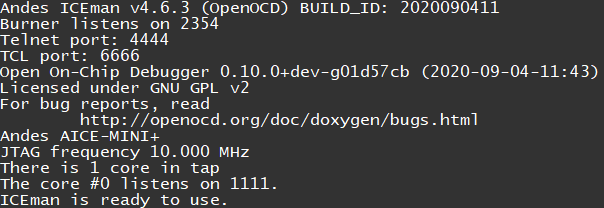
Run the following command.
sudo ./ICEman -Z v5
-
Launch another shell and navigate to the flash folder in which the SPI Burn tool is located (e.g. /opt/toolchain/telink_riscv_linux_toolchain/flash).
-
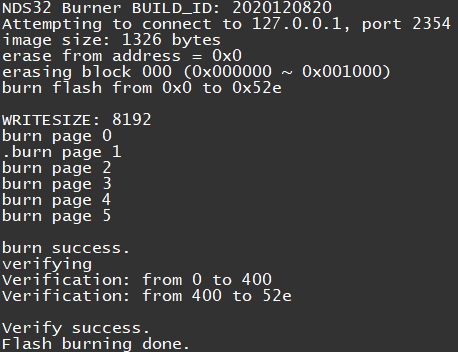
Type the following command.
sudo ./SPI_burn -i "$HOME/example/main.bin" -v
NOTE: the -i option specifies the binary file that will be programmed into the TLSR9518 EVK and the -v option enables verification after flashing.
Debugging
-
Navigate to the folder in which the example code located (e.g $HOME/example).
-
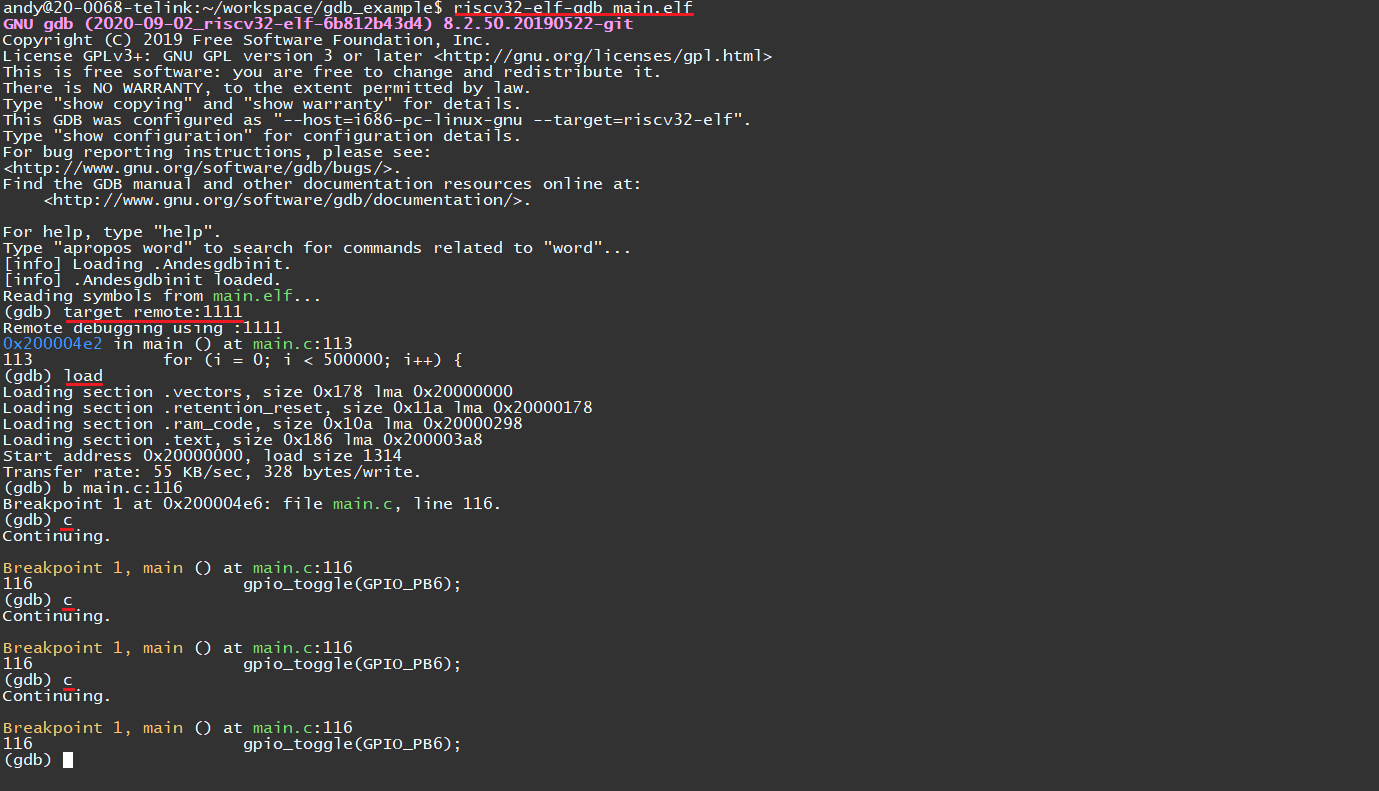
Run the following command to start GDB.
riscv32-elf-gdb main.elf
- In the GDB shell, type the two commands one by one below so that the GDB tool connects to the GDB server and then loads the example program.
    (gdb) target remote:1111
    (gdb) load
- Now you can start to debug your code using the commands provided by the GDB tool. In the example below, I set a breakpoint on one function before I have the program run. The GDB breaks when the breakpoint is hit. The led D3 toggles every time a “continue” command is entered.